In this post we will look at how hpcrun-flat can be used to profile an MPI application.
The program we will look at
solves a concurrent wave equation using point-to-point communications.
We will download and build perftools. We will then run the application
under hpcrun-flat. hpcrun-flat statistically profiles application
functions, and figures out the approximate time spent in each function or module.
Finally, we will upload the data to PerfBrowser Cloud, and see some pretty plots in our browser!
- Build perftools
- Download and build mpiwave
- Run mpiwave under hpcrun-flat
- Uploading hpcrun-flat data to PerfBrowser Cloud
- Visualizing in PerfBrowser Cloud
Build perftools
Let’s download and build perftools:
$ git clone https://github.com/tushar-mohan/perftools.git
$ cd perftools
Before we start the build, let’s make sure we have the build dependencies:
$ ./build.sh --checkdeps
Checking dependencies..
gcc.. ok
g++.. ok
gfortran.. ok
mpicc.. ok
mpirun.. ok
patch.. ok
curl.. ok
python.. ok
cmake.. ok
autoconf.. ok
bunzip2.. ok

All build dependencies satisfied.
If you encounter problems with build dependencies, check out the documentation for your Linux distro.
Let’s fire the build. We will add the --all flag to build the full
perftools’ suite, including hpctoolkit. This takes approximately 30
minutes, so make sure you have coffee at hand!
$ ./build.sh --all
If all goes well, the output will contain something like:
=======================================================================
Tools are installed in:
/home/tushar/perftools/perftools-1.2.1

To use the tools
----------------
module load /home/tushar/perftools/perftools-1.2.1/perftools
	   - or -
source /home/tushar/perftools/perftools-1.2.1/perftools.sh
	   - or -
source /home/tushar/perftools/perftools-1.2.1/perftools.csh

To test install:
make test
make fulltest
=======================================================================
So perftools were built, and installed in the subdirectory perftools-1.2.1.
Running the full test suite:
$ make fulltest
...
10 of 10 PASSED
make[1]: Leaving directory '/home/tushar/perftools/papiex'
If the first test fails, you may need to enable performance counter access for ordinary users.
Let’s add perftools to our shell environment:
$ module load /home/tushar/perftools/perftools-1.2.1/perftools
You may also want to add the above command to our .login or .profile.
At this point, we have hpcrun-flat in our PATH:
$ hpcrun-flat -V
hpcrun-flat: A member of HPCToolkit, version 5.4.0
You will also find hpcrun2json in your PATH. This script will
convert the binary hpcrun-flat output into json, suitable for
upload to PerfBrowser Cloud.
Download and build mpiwave
$ mkdir mpiwave; cd mpiwave
$ curl https://computing.llnl.gov/tutorials/mpi/samples/C/mpi_wave.c | sed /draw_wave/d > mpi_wave.c
$ mpicc -g -O2 -o mpi_wave mpi_wave.c -lm
We use sed to remove references to a draw_wave function, which is not pertinent to this study.
Run mpiwave under hpcrun-flat
Running the program under hpcrun-flat is simple. Note, at present
hpcrun2json can only handle single-event measurements with hpcrun-flat.
So, in the command-line below, we measure PAPI_TOT_CYC, with a sampling
period of 99999/second. You can increase the period for longer runs.
-tall combines all the thread profiles for a process into a single
shared profile. At present, we cannot handle individual thread profiles.
$ cd mpiwave
$ mpirun -np 16 hpcrun-flat -e PAPI_TOT_CYC:99999 -tall ./mpi_wave
Starting mpi_wave using 16 tasks.
Using 800 points on the vibrating string.
Enter number of time steps (1-10000):
10000
...
Once the run finishes, hpcrun-flat will create one profile per process,
so a total of 16 profiles for this run.
$ ls *.hpcrun-flat*
mpi_wave.hpcrun-flat.gulftown.31791.0x0  mpi_wave.hpcrun-flat.gulftown.31807.0x0
mpi_wave.hpcrun-flat.gulftown.31793.0x0  mpi_wave.hpcrun-flat.gulftown.31809.0x0
mpi_wave.hpcrun-flat.gulftown.31795.0x0  mpi_wave.hpcrun-flat.gulftown.31811.0x0
mpi_wave.hpcrun-flat.gulftown.31797.0x0  mpi_wave.hpcrun-flat.gulftown.31813.0x0
mpi_wave.hpcrun-flat.gulftown.31799.0x0  mpi_wave.hpcrun-flat.gulftown.31815.0x0
mpi_wave.hpcrun-flat.gulftown.31801.0x0  mpi_wave.hpcrun-flat.gulftown.31817.0x0
mpi_wave.hpcrun-flat.gulftown.31803.0x0  mpi_wave.hpcrun-flat.gulftown.31819.0x0
mpi_wave.hpcrun-flat.gulftown.31805.0x0  mpi_wave.hpcrun-flat.gulftown.31820.0x0
You may also want to run hpcstruct to generate loop information from the binary,
although we won’t be needing it for this experiment.
$ hpcstruct mpi_wave
$ ls *.hpcstruct
mpi_wave.hpcstruct
Uploading hpcrun-flat data to PerfBrowser Cloud
To view the hpcrun-flat profiles in PerfBrowser Cloud, we need the output to be in
JSON format. hpcrun2json will accomplish that.
If you haven’t done so, sign up for a free-trial PerfBrowser Cloud account. If you login using OAuth, make sure you set a new password. You will need it with pbctl.
Make sure your pbctl binary is setup. If not, it’s easy:
$ curl -s https://raw.githubusercontent.com/tushar-mohan/pbctl/master/pbctl -o $HOME/bin/pbctl
$ chmod +x $HOME/bin/pbctl
$ pbctl version
1.1.4
The first time you use pbctl, you will need to authenticate using your
PerfBrowser Cloud login and password:
$ pbctl login
Username or email: test123@example.com
Password:
Login successful (token saved)
Now let’s upload:
$ hpcrun2json *.hpcrun-flat.*| pbctl import
Events (1): PAPI_TOT_CYC
Ranks: 16
Uploading 111658 bytes..
{
  "id": 8,
  "info": {
    "nranks": 16
  },
  "name": "MKRZJNHQBG",
  "userId": 1,
  "webUrl": "https://perfbrowser.perftools.org/static/index.html#/jobs/8"
}
import of - successful
Visualizing in PerfBrowser Cloud
Copy-paste the URL emitted by pbctl import in a browser
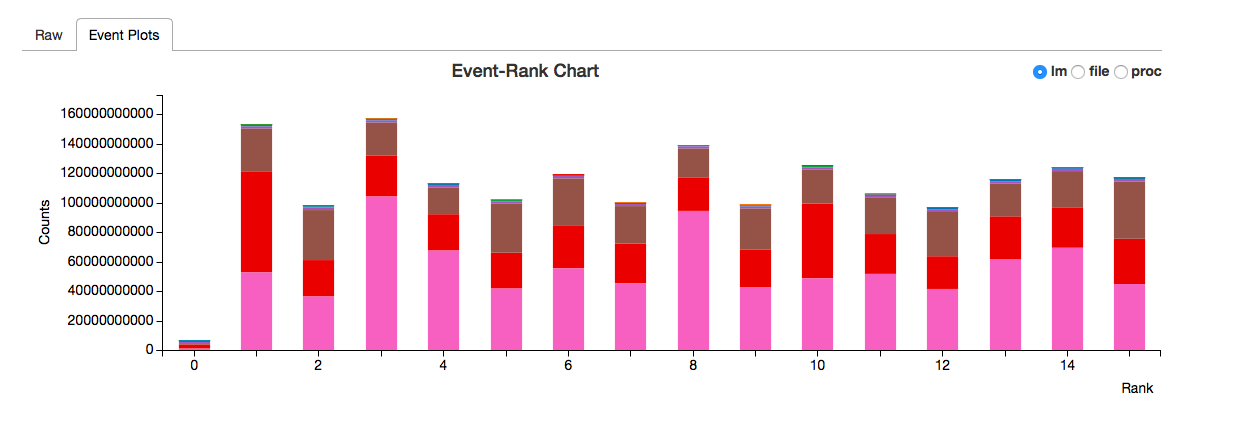
 The view shows
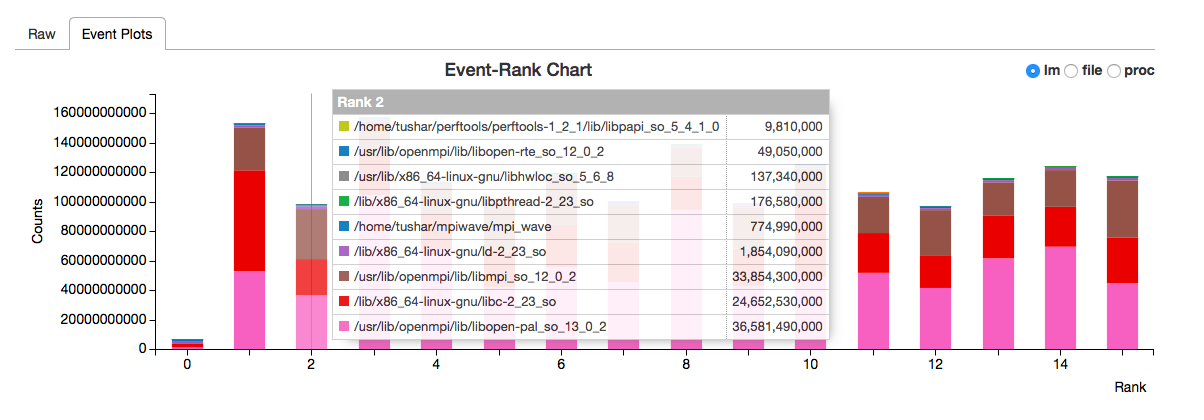
 PAPI_TOT_CYC (a measure of user cycles) spent in different modules
by each task. It’s interesting that rank 0 has the least user cycles. Clearly, the
work is done by other ranks. Also, you will see more than 50% of the time is spent
in the calls within the openmpi library.

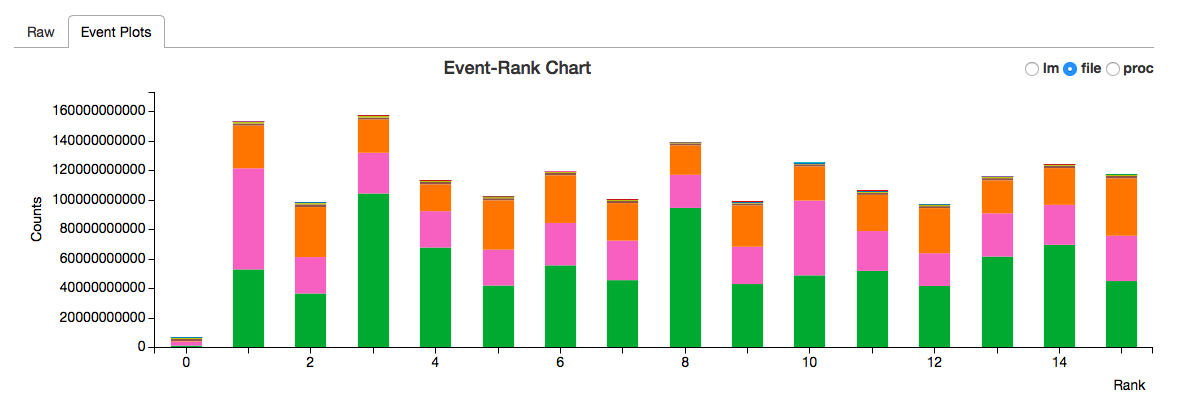
If you select file option radio button, you will see a breakup by file as below.
The proc corresponds to profiling by functions.
